
The Dow Jones Industrial Average ($INDU) may not be the comprehensive measure of the US economy it once was in the early 20th century. However, if you’re holding (or looking to hold) a position in a Dow-tracked index fund to diversify into blue chip stocks, it still helps to see where the index may be heading.
Analyst Forecasts Are Mixed
Analyst price targets for the Dow show a mixed range due to various economic factors. Let’s go through each case:
The Bullish Case
Optimistic forecasts have hinged on the hopes for a Federal Reserve rate cut, to which institutions like Goldman Sachs (GS), Citigroup (C), and Bank Of America (BAC) have raised their targets during the first half of 2024. There’s also a lot riding on the Tech sector’s strength, to which JPMorgan attributes the remainder of the broader market rally this year (without it, the JPM analysts forecast a possible 20% correction).
The highest forecast shows the Dow rising to 40,000 in 2024.
The Bearish Case
Nevertheless, JPMorgan analysts are pointing out the likelihood of a pullback due to slowing global growth, declining household savings, and geopolitical tensions. BCA Research also offers a particularly bearish outlook, warning of potential market crashes driven by recession risks.
The lowest forecast is that the Dow will fall to at least 34,000 by the end of 2024.
What Do the Technicals Say?
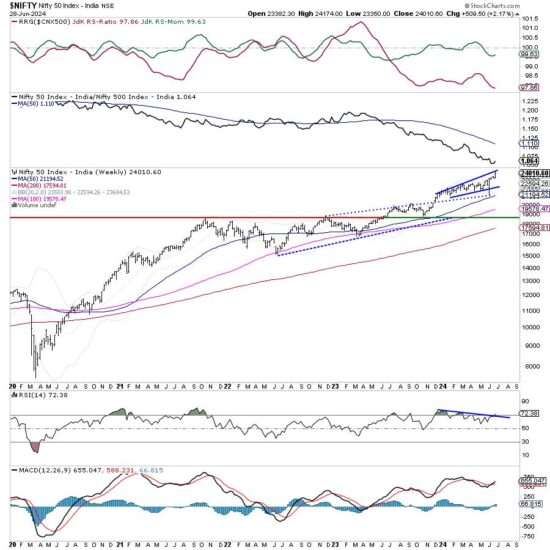
The Dow’s weekly and five-year performance demonstrate a sustained uptrend. The 50-period simple moving average (SMA) may have exhibited more fluctuations than the 200-period SMA, but both have moved steadily upward.
CHART 1. WEEKLY CHART OF THE DJIA ($INDU). Volatile, yes, but all upside, it seems.Chart source: StockCharts.com. For educational purposes.
If you rely on the Chaikin Money Flow (CMF) to accurately represent momentum, you can see that the buying pressure has largely been maintained throughout the entire five-year period. However, both the CMF and the Relative Strength Index (RSI) also point to near-term weakness, as indicated by a bearish divergence from price action, which also appears to form a double-top pattern.
The near-term downward pressure is more pronounced if you look at a daily chart (see below).
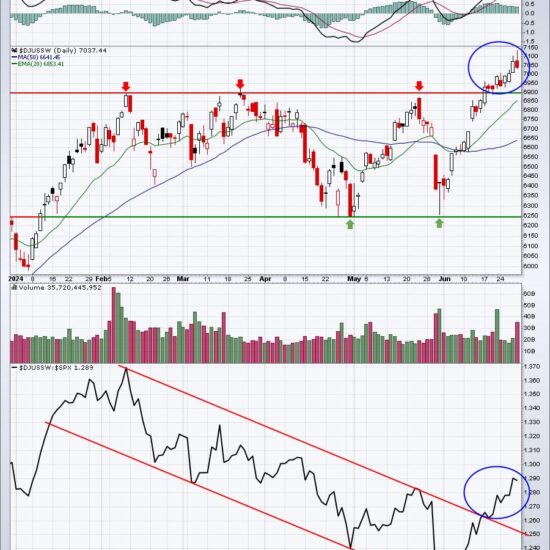
CHART 2. DAILY CHART OF THE DOW ($INDU). If the Dow falls, and it looks like it might, here are the key levels to watch.Chart source: StockCharts.com. For educational purposes.
Lacking any compelling positive (fundamental) factors to drive stocks higher, it might be safe to assume transitory softening in the Dow’s trajectory. The bears could push the Dow below the short-term trend line (see green-dotted line), which sets right below the 38,500 level.
If you’re siding with the bull case mentioned near the top of this article, the first solid level of support is highlighted by the blue dotted line around 37,000 (below the 38.2% Fibonacci Retracement line). This level coincides with the 2021 high, which the Dow broke above in December 2023.
The next level of support, marked by a dotted blue line, sits between the 50% and 61.8% Fibonacci Retracement lines at around 35,700. This level marks a critical resistance level tested three times—in 2021, 2022, and 2023—before the price surged past it last November.
If you lean more toward the bearish side of things, leaning more toward the potential 20% broader market correction that JPM warned about, then you might see prices fall well below the 61.8% Fib retracement line toward the 34,000 level.
The Takeaway
The Dow Jones Industrial Average (DJIA) may not be the all-encompassing measure of the US economy it once was, but it’s still relevant for those investing in blue-chip stocks. Analysts are divided: optimists see the Dow reaching 40,000 by the end of 2024, driven by hopes for a Fed rate cut and Tech sector strength, while pessimists warn of a drop to 34,000 due to global economic slowdowns and geopolitical issues. Nobody knows how economic factors and Fed messaging (plenty of Fed speeches this week) will cause investor sentiment to respond. It’s a wait-and-see moment. But, at the very least, you now have a few key levels to watch, whichever side (bull or bear) you find yourself in.
Disclaimer: This blog is for educational purposes only and should not be construed as financial advice. The ideas and strategies should never be used without first assessing your own personal and financial situation, or without consulting a financial professional.